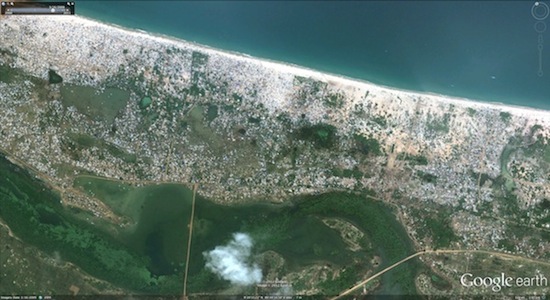
Every single white dot in the satellite image above, taken in March 2009, is the temporary shelter for an internally displaced family in Sri Lanka. When viewed at full resolution on Google Earth, it is a mind-boggling concentration of people in conditions that were absolutely appalling.
After working on it for a whole day, I published on Groundviews (The end of war in Sri Lanka, captured for posterity by Google Earth)the first article ever to be written on looking at the denouement of Sri Lanka’s 27 year old war through historical satellite imagery available on Google Earth.
As noted in the post on Groundviews,
Usually, satellite imagery is inaccessible for crowdsourced analysis because of one key factor – money. A single tile (say a frame of 1km by 1km) can cost thousands of dollars to acquire, making satellite image acquisition theoretically a commercial possibility, but in fact, impossible for any Human Rights organisation in Sri Lanka to even imagine undertaking. At scale and over time, this is not something even the largest International Human Rights organisations can afford.
Google Maps / Google Earth offer, for our purposes, two advantages over the acquisition of commercial satellite imagery, the cost saving aside. One, the availability of good enough satellite imagery to work with. The other, historical imagery, from 2009, to compare and contrast specific geographical areas and any visible changes. There is historical imagery from as far back as 2005 and up to the end of 2011, but for the purposes of this study, imagery dated 3/16/2009, 5/24/2009, 6/15/2009 and 9/8/2009, which show the most amount of detail on shelling and the locations of the so-called Civilian Safety Zones (CSZ), have been used extensively. A final advantage of crowdsourcing this kind of work is that it is, in a sense, open data. Anyone, from anywhere, for free, can confirm or contest a sighting of something interesting, and flag other points of interest.
What Google Maps and Earth does NOT enable one to do, given (1) the quality of some of the historical imagery (which sometimes features extensive cloud cover of vast regions) and (2) the large gaps between the available historical imagery (mid March, late May, after the official end of the war and killing of the LTTE’s leader, then mid-June and early August) is any robust analysis on when shelling in a specific region took place, and importantly, by whom.
In fact, what Google Earth’s satellite imagery does do is to narrow the scope of investigation, by zooming in on specific locales that look as if they are sites of possible war crimes and crimes against humanity – for example, shelling in and around areas with a high concentration of Internally Displaced Persons (IDPs). So instead of acquiring hundreds of tiles at astronomical cost just to determine areas that need more study, Google Earth’s imagery can help organisations hone in on areas that warrant further investigation, and far better resolution imagery than what Google Earth offers.
To quote the article from Groundviews again,
Ultimately, what Google Maps / Earth have recorded, and quite clearly, is the sheer scale and extent of the destruction and human displacement in Sri Lanka during the final phase of the war, between March and May 2009. Plotted on a map, seeing this is fundamentally different to reading about the same information in a static report.
The article asked readers to share the story, explore the imagery on their own desktops and report back on what they say, felt and found.
