
Authors are from the Foundation for Environment, Climate and Technology, Kandy
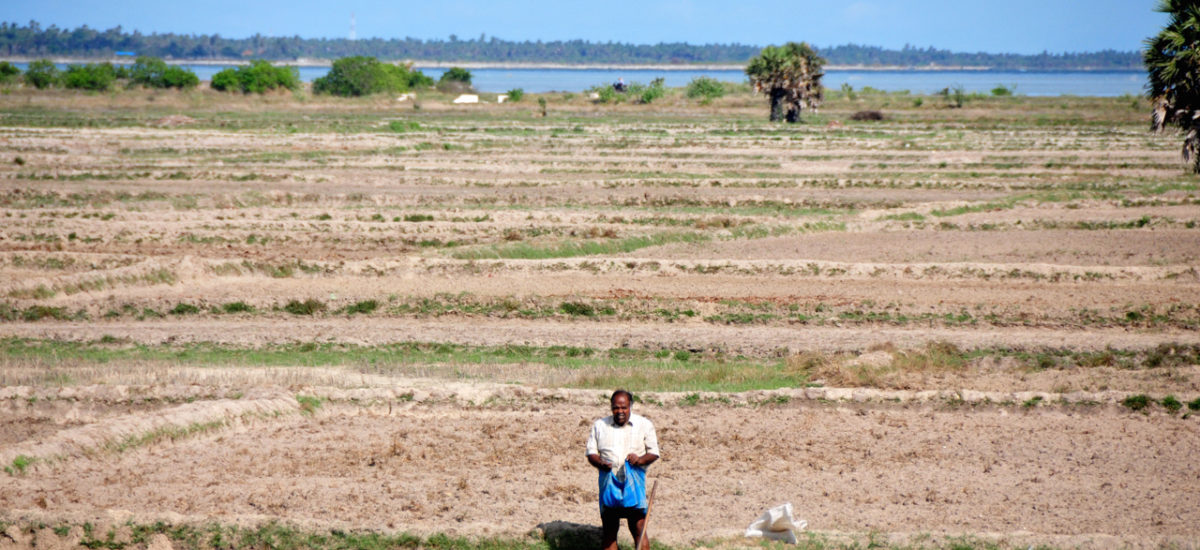
Featured image courtesy Amantha Perera for IRINNews
Drought has followed the floods in mid-May in Sri Lanka, affecting 625,000 people directly along with agriculture, water supply, irrigation and nature. Here, we quantify this drought and show that it (a) is most severe in the Eastern and North-Central Provinces; (b) was due to markedly low rainfall after May, (c) has reached the intensity of the initial phase of the last major drought of 2013 and (d) shall likely not be sustained for as long.
Which areas are most affected?
According to the Disaster Management Center, 625,000 people were affected by the drought by 13th October 2016. Out of this 45% were from north-central and eastern provinces. 130,000 people (30% of the district’s population) were affected by drought in Polonnaruwa district (Figure ) along with large numbers in Batticaloa, Ampara, Moneragala, Hambantota, Kalutara, Puttalam and Kilinochchi districts. About 13% of the populations in Kilinochchi and Batticaloa districts were affected.
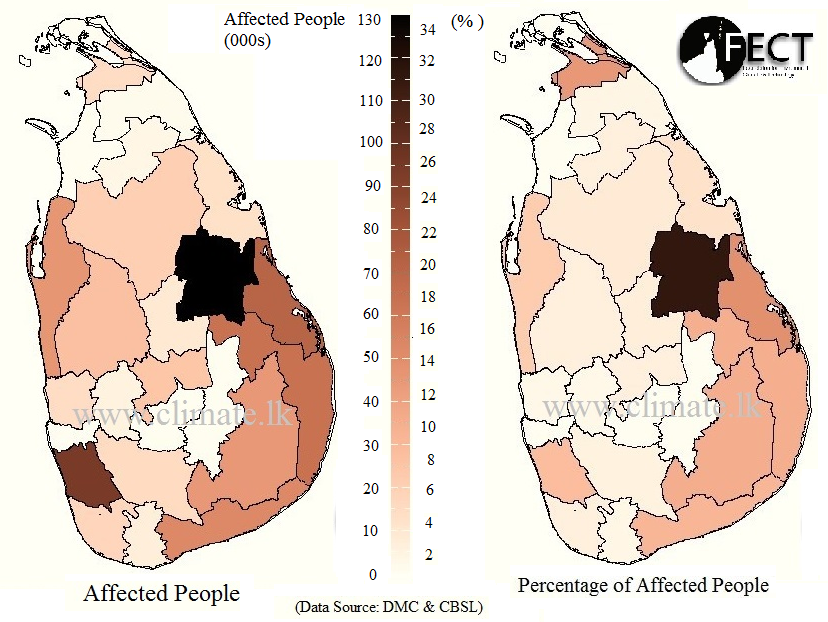
Figure 1: The number of affected people (left) and the percentage of affected people (right)
Impact on Water Storage
Notwithstanding the heavy May rainfall in the headstream areas of Mahaweli, Kelani, Kalu, Walawe, and Deduru Rivers, the reservoirs have been depleted more than is typical and below is a summary of storage in reservoirs used exclusively for Irrigation and in addition for hydropower.
Irrigation Reservoir Storage
Most of the major reservoirs are filled to less than 50% of their respective capacities in mid-October. Water levels of many reservoirs have gone down significantly. The storage in most reservoirs in Ampara, Trincomalee, Moneragala, Anuradhapura and Polonnaruwa districts has fallen below 35% of their capacity while storage in reservoirs in Batticaloa and Mannar districts have fallen below 20% and 10% respectively.
Reservoirs in the Head Stream and Hydropower Generation
Hydro-electricity reservoir storage capacity was at 86% at the beginning of 2016 and decreased steadily to 34% by April. Heavy rains in May filled up the reservoirs back up to 76%. By early-October, the capacity has once again come down to 51% (PUCSL). The contribution of CEB hydro power plants in May 2016 had been 33% of the total generation. This has come down to 15% in September 2016.
This Yala’s Climate
In the months leading into the Yala (April to September), rainfall was less than that in 4 out of 5 previous years (Figure 2). Then in mid-May heavy rainfall was received by the entire country and then relatively dry weather prevailed throughout the country until mid-October.
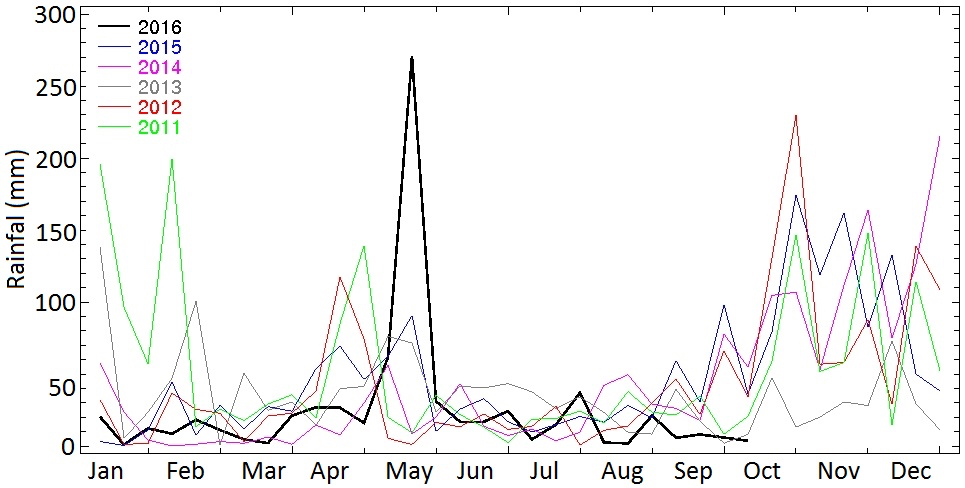
Figure 2: Average rainfall for Sri Lanka from January to October 2016 (black) and those in previous 5 years for January to December. The rainfall estimates are from satellites which compare closely with ground observations.
The rainfall deficit was made worse, as the temperature was at record levels this year, leading to a big rise in evaporation.
Measuring and Monitoring Drought
We have shown that the Weighted Anomaly Standardized Precipitation (WASP) Index is able to capture drought in Sri Lanka at fine-scale as represented by relief payments between 1960 and 2000 (Zubair et al., 2006, Lyon et al., 2009). The WASP index takes the deficits in each month as a ration of the rainfall that is expected in that month while giving higher value to more recent rainfall – given the rainfall seasonality of Sri Lanka, we find a three month WASP index to be best.
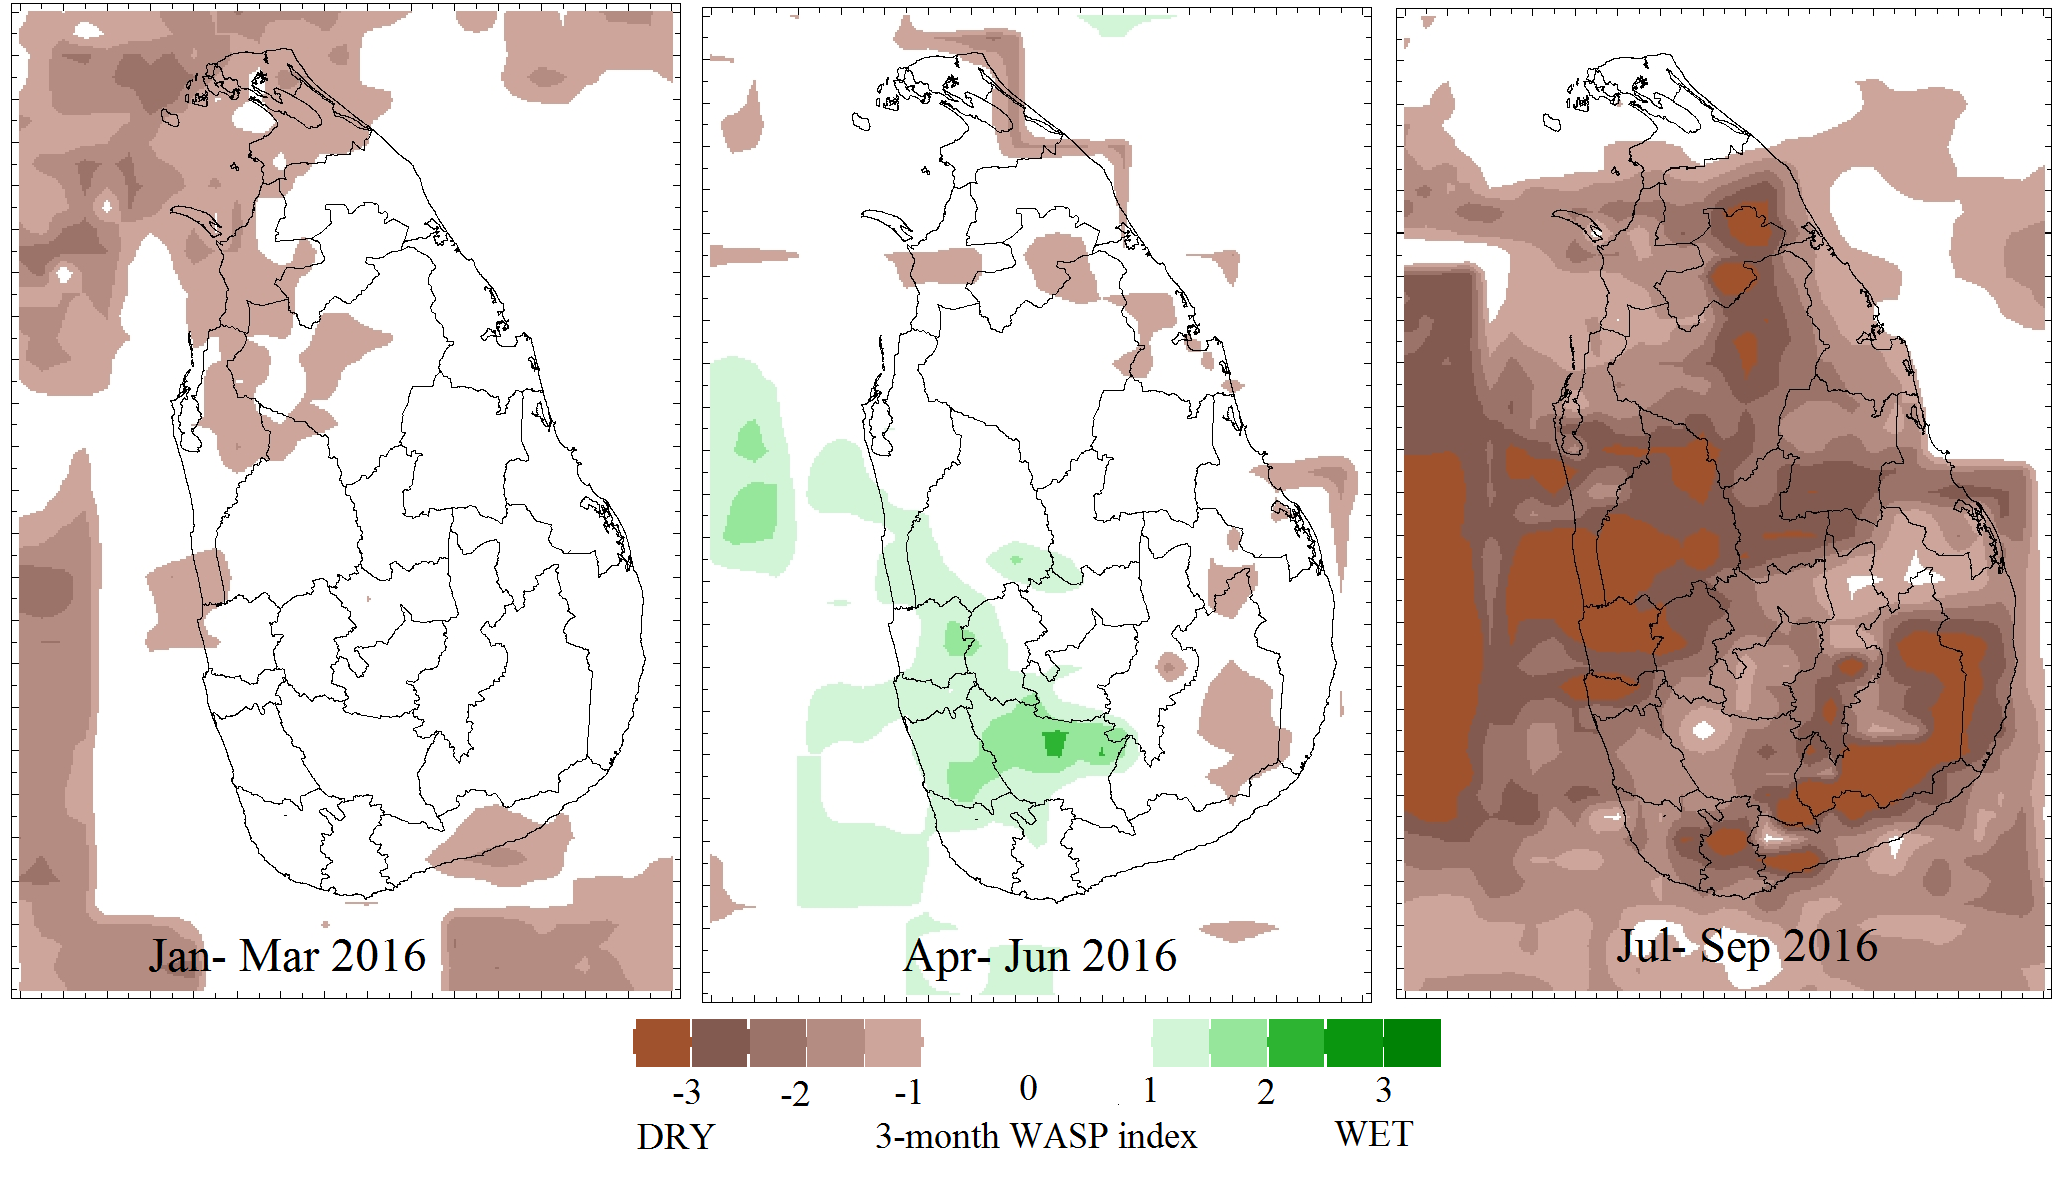
Figure 3: Drought estimates using the 3-month WASP index for (Left) January – March, Middle (April-June) and Right (July to September) of 2016. Note that if the WASP index is between -1 and -2 it is defined as “moderately dry”, and between -2 and -3 is “very dry” and if the index is below -3 such areas are “extremely dry”. We know from previous work that the satellite rainfall data used here is skillful for Sri Lanka.
As seen in the maps of WASP indices in figure 3, conditions had been slightly dry in northern, north-western and south-western regions in the first quarter. In the second quarter, these dry conditions were mitigated by heavy rainfall in May. However, the rainfall deficits that began in June kicked in and extreme drought became established in the following months.
Polonnaruwa is the worst affected district. The monthly WASP index for Polonnaruwa (figure 4) shows that July-September 2016 drought conditions have been the fourth worst in the last 15 years. This figure also shows that the most sustained and severe drought over the last 15 years was the one in 2013-2014 and the present drought while severe is not as sustained yet.
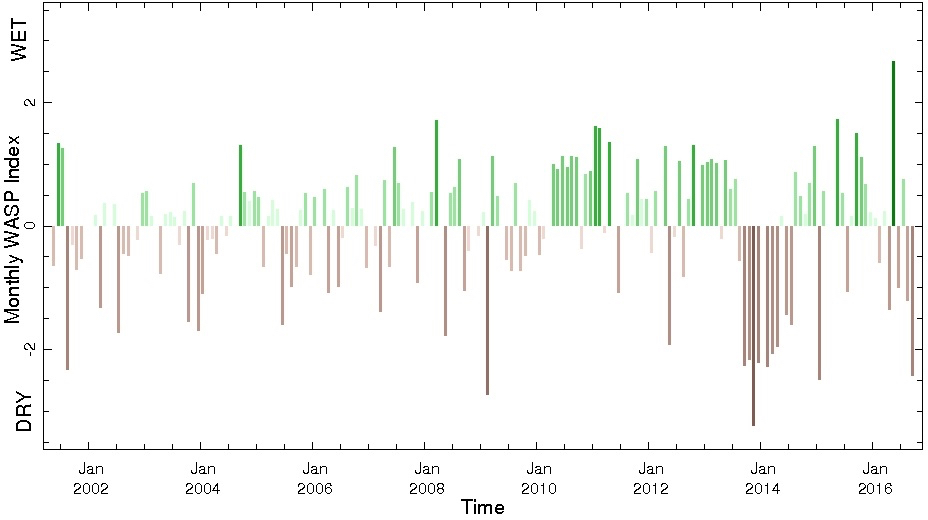
Figure 4: The monthly WASP drought index for the Polonnaruwa district since 2001
Role of El Nino
From May 2015 El Niño conditions persisted for almost a year until May 2016. El Niño condition was one of the contributors to suppressed rainfall and record temperature until April and to the May deluges. Although there has been a transition to a La Niña now, in the intervening period rain was suppressed and temperature was higher in a manner reminiscent of an El Niño.
What is likely to follow?
Usually the period from October to December have the heaviest rainfall in Sri Lanka. Even though La Nina conditions typically lead to lower rainfall from October to December, there should still be relief from the drought as these are wet months even with a La Nina. Questions remain as to (a) how soon the rains shall arrive, (b) whether the magnitude of rainfall shall be sufficient for the Maha cultivation, water supply needs and hydroelectricity demands and (c) whether there shall be sufficient carryover storage to take care of the dry season after January. On this shall ride the health and welfare of humans, their livelihoods, the economy, and ecosystems in Sri Lanka.
Note: The Foundation for Environment, Climate and Technology (http://www.climate.lk ) provides an update every Friday for those managing national water resources which we also make available freely via http://fectsl.blogspot.com and http://www.twitter.com/fectlk and our e-mailing list at http://www.climate.lk/subscribe.html .
Reference
Lyon, B., Zubair, L., Ralapanawe, V. & Yahiya, Z., (2009). Finescale evaluation of drought in a tropical setting: case study in Sri Lanka. Journal of Applied Meteorology and Climatology, 48(1), pp. 77-88.
Zubair, L., V. Ralapanawe, U. Tennakone, Z. Yahiya, and R. Perera (2006), Natural disaster risks in Sri Lanka: Mapping hazards and risk hotspots, Chapter 4, in Natural Disaster Hotspots Case Studies, Washington, DC: World Bank 2006.
Readers who enjoyed this may find “Is the Air Pollution Analysis for the Sampur coal plant credible?” and “Sri Lanka Floods 2016: Avoiding the Mistakes of 2004” instructive.