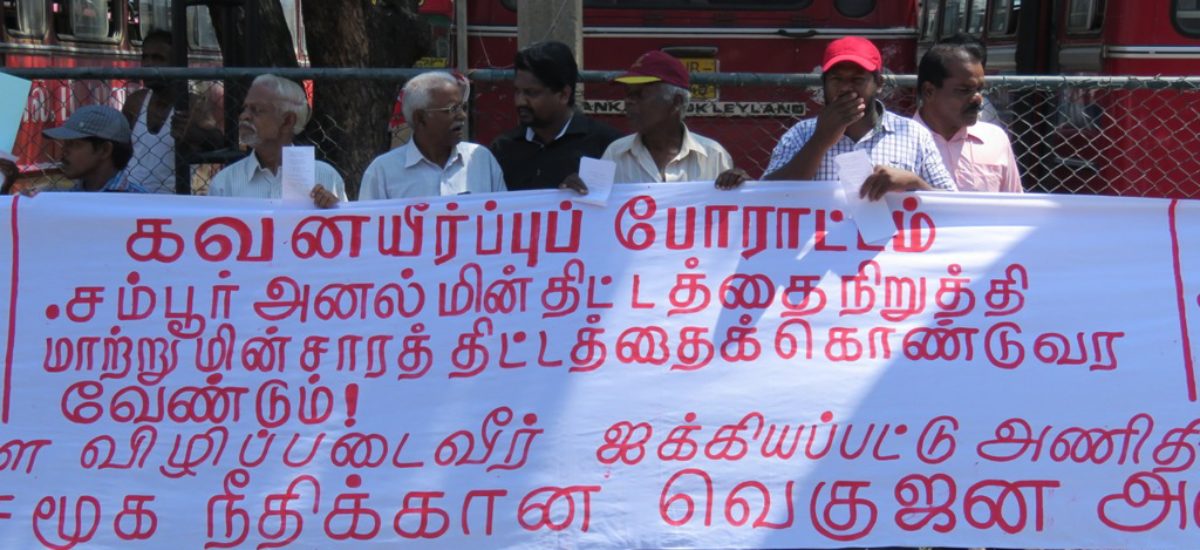

Featured image courtesy Tamil Guardian
From Lareef Zubair, with contributors Shashini Rathnayake, Janan Vishwanathan and Zeenas Yahiya of the Foundation for Environment, Climate and Technology
Where does the Wind take pollutants from Sampur?
As per modern myth, school texts, national atlases, and indigenous forecasters, the wind blows from the North-East over Sri Lanka at the turn of the calendar year. Even the birds know it. The transcontinental migrants draft on the North-Easterlies and steer to hone in to Hambantota for the Siberian winters. However, the analysis of atmospheric pollution in the Environmental Impact Assessment (EIA) for the coal burning power plant proposed at Sampur presumes that the wind blows from the South-East. On this discrepancy, rides not only the credibility of the EIA but impacts of profound consequence.
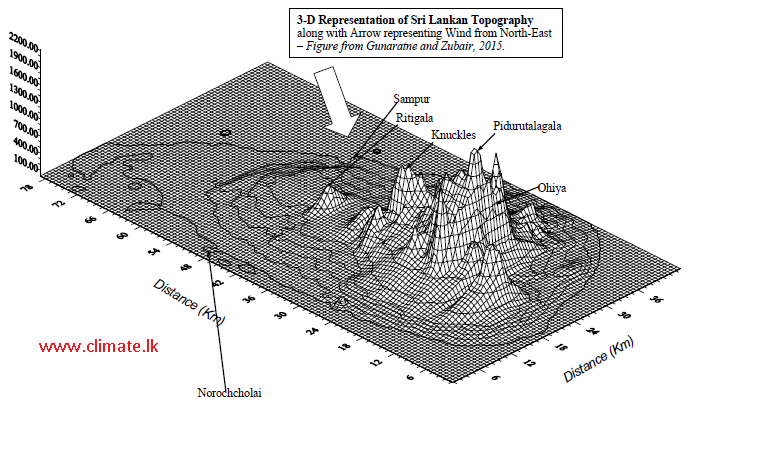
A 3-D visualization of Sri Lanka topography. Courtesy: Gunaratne and Zubair, 2015.
If the wind is from the North-East, it shall entrain the pollutants from Sampur towards the central mountain ranges from Ritigala to Namunukula. Mountains amplify the impacts of pollutants on atmospheric chemistry and cloud physics. Even a modest rise in toxic gases can have damaging consequences on the air people and animals breathe, the water they drink, and ecosystems. This can impact the quality of tea, agriculture and homegardens not on the slopes, and downstream and hydropower generation.
Coal burning power plants release dust and pollutants and toxins such as Mercury into the atmosphere. Every year, the Sampur plant is projected to vent 10,000 tons of Sulphur Dioxide, 10,000 tons of Nitrous Dioxide, 1700 tons of other particulate matter and other toxins and 4 million tons of Carbon Dioxide. These are monumental quantities that cry out for serious attention.
To show that this is safe, the EIA consultants from New Delhi, Mantec Consultants Ltd, rely on a computer model which tries to mimic the venting of these chemicals into the atmosphere. Such computer models are built on vast generalisations and shaky assumptions. To mitigate the shortcomings, all available data should be used after careful quality control and the results should be cross-examined.
The Wind over Sri Lanka from December to February
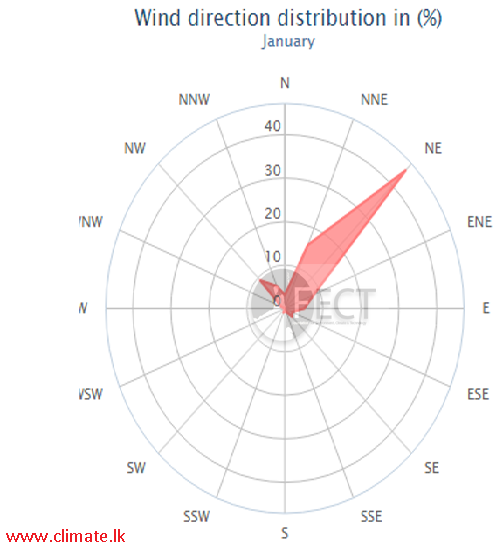
Mantec relies on one year of observations by Ceylon Electricity Board (CEB) at Sampur and another month of their own measurements. This is a hundredth of the wind observation that are available. It may be that the CEB instruments registered something extraordinary over Sampur from December 2012 to February 2013. This possibility should be entertained after cross checking the data against observations in the neighbourhood. Usually when one undertakes environmental observations in a new site, stringent checks should be undertaken. Often there are instrument errors, calibration errors or simply misalignment or errors in recording data. No reports on quality control have been presented. The “windrose” from Mantec which represents the direction from which wind comes and is shown here is consistent with the Mantec finding that the wind from December to February comes largely from the South-East.
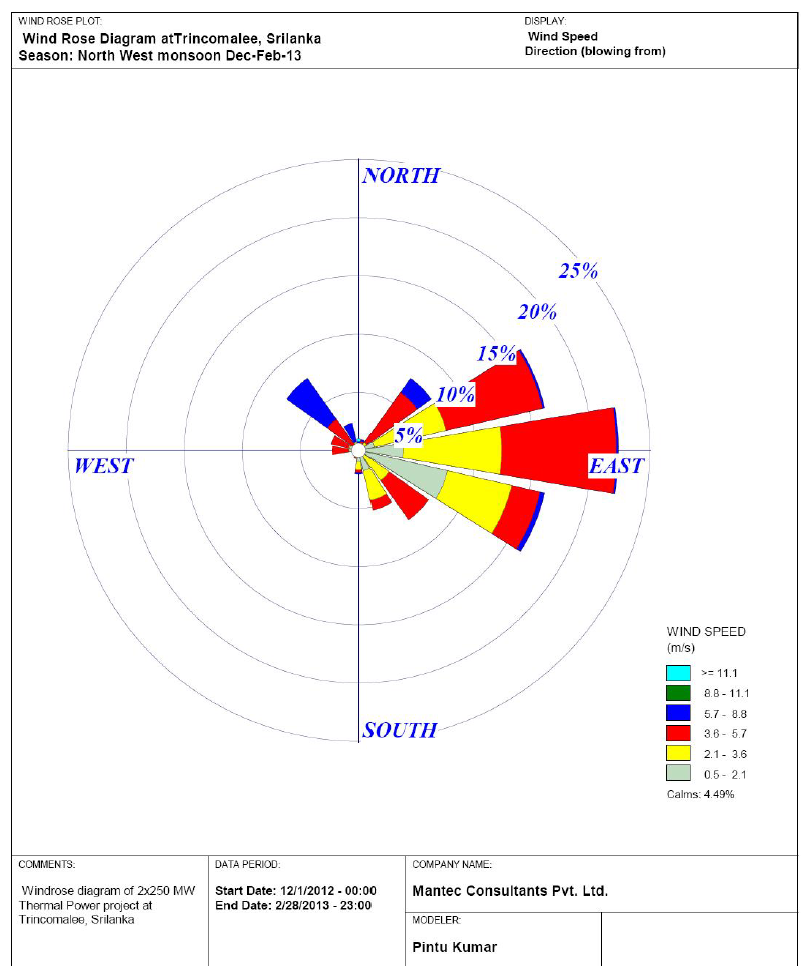
The “Windrose” is a representation of which direction the wind comes from. The distribution of wind speeds from each direction December 2012 to February 2013 is shown as estimated by Mantec. Courtesy: Sampur EIA from Mantec.
The wind directions for December to February that Mantec has presented are at odds with measurements from the Department of Meteorology, the Air Force, by the Ceylon Electricity Board (CEB) elsewhere and our own institute in Kandy. Satellite wind observations and climate model simulations too present North-Easterly flows. There are dozens of research papers to confirm this – for example, the CEB observations at Sita Eliya (Zubair, 2002a) and Hambantota (Zubair, 1998).
Above: The average wind from observations during January at a height of about a km is shown as an arrow. The average rainfall is shown in shades of green and as contours. Below: Windrose for January for 16 years observation at China Bay, Trincomalee. The wind direction in this case is from the North-East.
Assumptions & Generalisations Regarding Wind and Air Pollution in the EIA
There are other causes for concern. Mantec have made the following inter-locking assumptions and generalisations:
a) The wind measurements in Sampur represents the wind across the East.
A better accounting of regional variation in wind is needed. There are variations due to location, storms, mountains and sea breeze. The sea-breeze and the desiccating mountain slope winds (“kachchan kaththa”in Tamil) affect Sampur in a particular way.
b) Wind observations at Sampur can be extrapolated to higher elevations
The CEB instrument does not reach the high elevations that the pollutants travel to. It is hard to capture the wind profile at higher elevations without observations. The assumptions in the software developed in the USA about the upper air should have been verified for our specific equatorial geography.
c) One year of wind observations is enough
The wind varies substantially from year to year variation of wind in Sri Lanka. For example, in some years there are storms and even cyclones. In other years, the El Nino alters the wind flow. One cannot just use one year of data to project for the next half century, if serious.
d) The past can represent the future
With climate change (Zubair et al., 2015), one cannot assume that the past represents the future. The EIA does not address the risks posed by climate change such as more frequent intense rainfall, cyclones, a rise in sea level or changing wind and storm patterns, all of it of relevance for Trincomalee.
These shortcomings could have been mitigated by making use of all available data, consulting past research, addressing inconsistencies and communicating what risks this analysis has not addressed.
Pollution Concentrations on the Ground According to the EIA
Based on these data and assumptions, the Mantec model estimates dispersion of dust, nitrous oxides, sulphurous oxides and particulate matter under idealised conditions. For example, there shall be no plant breakdowns or accidental large releases – both occurrences of undue frequency at Norochcholai. Essentially the model projects how much of the dust shall settle in the region just surrounding the power plant. They limit their analysis to 20 kilometres. The wind data for December to February largely blows from in-between the East and South-East directions.
The output from the Mantec model perplexes – for example, in the December to February period, the pollutants are carried towards the South-East and into the sea. In other words, the pollutants go against the wind. Nowhere on the earth’s surface is passive matter known to go against the wind.
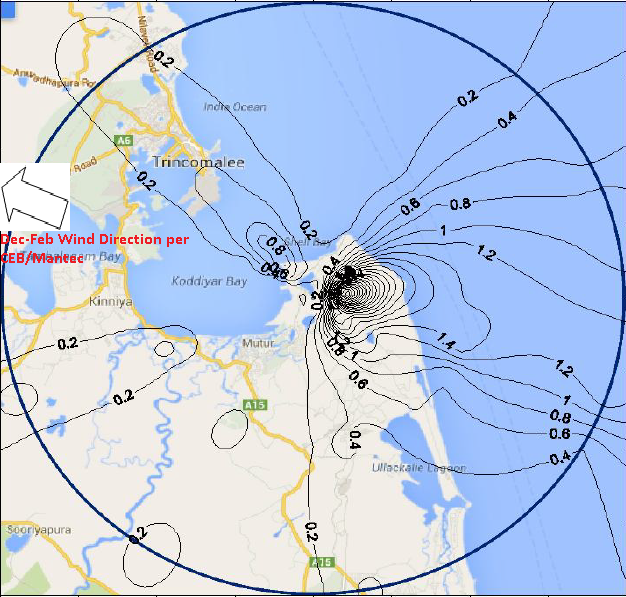
Nitrous Oxide Pollution for Dec-Feb period as estimated by Mantec: The contours shows the peak concentration of nitrous oxides for a day due to the emissions. We inset an arrow to show the South-Easterly wind direction that the wind comes from according to Mantec. Notice, the contours with higher concentration is drawn towards the South-East against the direction of wind. In other seasons too, the pollutants appear to go against the wind in their models. Source: Mantec EIA Report.
In an attempt to validate the Mantec model results, the Industrial Technology Institute (former CISIR) was contracted by Mantec to undertake similar simulations. The ITI model – which is a commercial version of what Mantec used – too relies on similar assumptions and generalizations. They too use only one year of wind data albeit from a climate model run in the US and no ground observations. Not enough information is given in the EIA for comparison across seasons. However, the patterns of dispersion of pollutants they project is misaligned with that from Mantec and the pollutant concentrations is several times that from Mantec. The EIA does not reconcile the discrepancies which defeats the objective of validation.
Not matter how complex the models or are how attractive the outputs appear, the truth that all modelers live by – “Rubbish In, Rubbish Out” – holds.
What Can We Infer for Mountains and the Atmosphere Above us?
Wind and Rainfall in the North-East Monsoon
As the North-Easterlies winds take moist air up the mountain slope, it encounters cooler temperatures. As it cools, the water vapour in the air condenses into tiny droplets. These droplets forms only on tiny impurities that are found even in the pristine air in the East. These droplets keep growing into clouds until they are large enough till they burst and fall as rainfall. This mechanism is what gives us the heaviest rainfall on the eastern slopes of our hills from December to February (Zubair, 1999).
Increase the pollution levels even modestly, and the droplets shall become a mist rather than a rain cloud and pass over the mountains an onwards West. Not only can such slight increases in pollution reduce rainfall, it can also reduce solar radiation and change evaporation. It can reduce the flow in our eastern streams and disturb the ecosystems from the hills to the eastern coast directly.
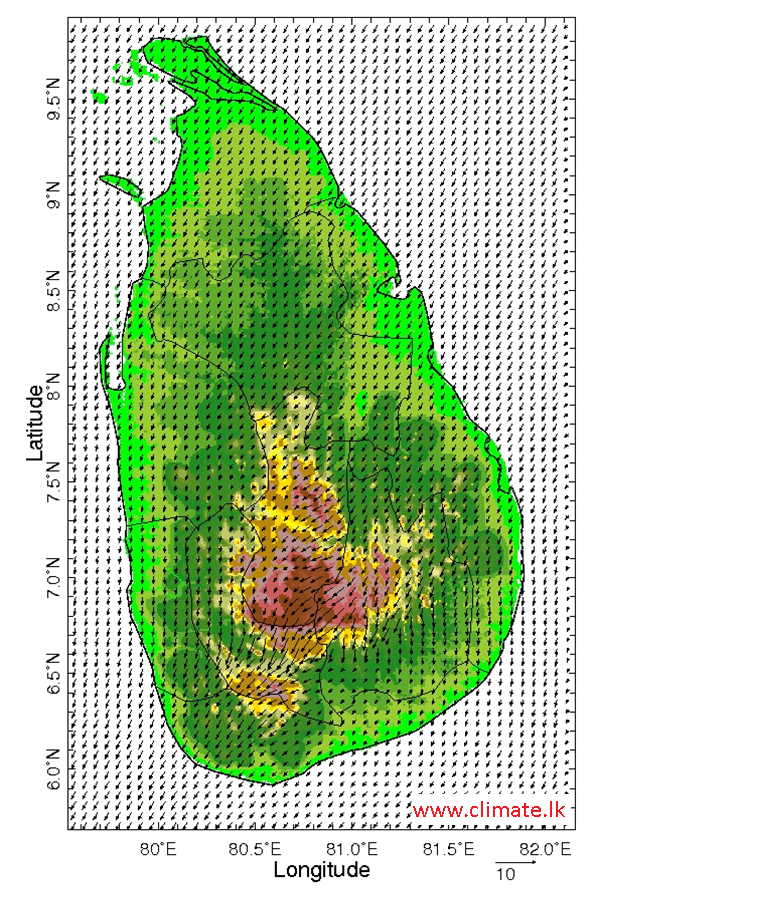
Average Wind estimated from observations and simple laws of nature for December. The size of arrow for wind speed of 10 meters/second is shown at the bottom-right. Source: Gunaratne and Zubair, 2015.
Impacts of Pollution Streams on the Mountain Slopes
The sulphurous and nitrous oxide emissions along with the heavy metals can lead to toxic rainfall. This can have far reaching consequences on our climate, the health of humans, ecosystems, water supply, air we breathe, the quality of tea, agriculture, and hydropower generation. The contamination shall be not only on the eastern mountain slopes but be carried to the eastern slopes and and to the coasts by rain and rivers.
Two decades back, Prof. Oliver Illepurama’s research group undertook studies in Kandy and reported that air pollution levels for some of the gases released at Sampur were hazardous much more than in Kandy (Illeperuma and Abeyratne, 2002) – things have only got worse since (Illeperuma, 2015). Thus in Kandy, the only place we have data, it is clear that there is a hazard to public health from the additional risk from Sampur.
Learning from other Coal Plants
The surroundings of the Norochcholai power plant are covered in dust particularly when the wind blows from the South-West. No government body monitors and reports on it. And one can only describe this as willful and convenient blindness by the state.
As poorly anticipated, monitored and mitigated as the air pollution at Norochcholai is, the consequences at Sampur can be worse. The wind field and topography is such that the pollutants from Norochcholai are entrained away from our mountains but not that from Sampur.
Some argue that combustion technology and air scrubbing system is more advanced at Sampur Power Plant. This assurance needs to be taken with caution. A model “clean technology” coal power plant was installed 3 years ago in Mississippi, USA in much more advantageous circumstances, and despite all the promises and state support, it has only left massive pollution far and no one accountable to clean up (New York Times, July 5, 2016).
Credibility of the Air Pollution Analysis
When anyone proposes to experiment with our atmosphere by injecting millions of tonnes of chemicals for multiple decades, we should take extraordinary care. We must have air pollution projections which are transparently done, are scientifically defensible, and undertaken with integrity, technical competence and professionalism. The results should be presented openly and reviewed independently . By using air pollution models which are limited by design in what it can anticipate, by using input data that are suspect, by not consulting what is already known, by providing no credible validation, by limiting the checks to pollution levels at the ground alone, and by not being forthcoming about the limitations, the EIA process for the coal plants has not credibly addressed the danger ahead.
According to the EIA regulations (Zubair, 2002b), those affected should be informed and consulted in formulating the projects. If the fisher-folk of Sampur whose livelihood and health likely is compromised by this project and who know to live by their wits through an intimacy with the rhythms of the air and seas had been asked, they could have told the Consultants from New Delhi and Colombo and their clients, as to which way the wind blows.
References:
- Abeyratne, V.D.K. & Ileperuma, O.A., (2011). Air pollution monitoring in the city of Kandy: possible transboundary effects. Journal of the National Science Foundation of Sri Lanka. 34(3), pp.137–141. http://jnsfsl.sljol.info/articles/abstract/10.4038/jnsfsr.v34i3.3644/
- Illeperuma, O.A. (2015), Open Dalada Veediya to Reduce Air Pollution in Kandy, Island, January 23, 2015.http://www.island.lk/index.php?page_cat=article-details&page=article-details&code_title=118175
- Zubair, L., 1998, Diurnal and seasonal variation of surface winds at Hambantota, Journal of the National Science Council, Sri Lanka, 25(3).235-245p. http://jnsfsl.sljol.info/articles/abstract/10.4038/jnsfsr.v26i3.5006/
- Zubair, L., 1999, Modeling Orographic Rainfall in Sri Lanka, Meteorology Beyond 2000, Transactions of the Indian Meteorological Society, February 1999, 269-273.
- Zubair, L., 2002a Diurnal and Seasonal Wind Climate at Sita Eliya, Sri Lanka, Theoretical and Applied Climatology, 71 (1-2): 119-127.http://link.springer.com/article/10.1007%2Fs704-002-8212-2
- Zubair, L., 2002b, An Assessment of Environmental Impact Assessment in Sri Lanka, Environmental Impact Analysis Review, 21(5): 469-478. http://www.sciencedirect.com/science/article/pii/S0195925501000816
- Zubair, et al. (2015). Climate Change Impacts on Rice Farming Systems in North Western Sri Lanka, In Handbook of Climate Change and Agroecosystems: Global and Regional Aspects and Implications. D. Hillel, and C. Rosenzweig, Eds., ICP Series on Climate Change Impacts, Adaptation, and Mitigation, Vol. 3. Imperial College Press. http://nix.nasa.gov/search.jsp?R=20150010249&qs=N%3D4294966724