My life changed, after I figured out how to create customized chart templates in PowerPoint. Things were so much easier when it came to creating charts, that I could spend the time saved on something else—like checking my Facebook page ;)
Here, I would like to share with you how to create, use and install a custom chart template.
1. Creating and Saving Templates
- In PowerPoint, go to "Insert" ribbon and click on "Chart" button under "Illustrations" group.
- Select preferred chart type an d click "OK." I have used a clustered column chart for this illustration.
- You will get a chart like this with the default colors of your current template. Apply the formatting that you prefer. Below is my sample chart after formatting:
- Now that you're done with formatting the chart, it's time to save the chart as a template. To do so you need to:
- Click on the chart, go to "Design" ribbon under "Chart Tools," click on "Save As Template" button in the "Type" group.
- In the "Save Chart Template" dialog box, choose a name and click "Save." Make sure to keep the ".crtx." file extension. The chart template will be saved in:
- Windows Vista/7:
"C:\Users\Username\AppData\Roaming\Microsoft\Templates\Charts\" - Windows XP:
"C:\Documents and Settings\Username\Application Data\Microsoft\Templates\Charts\"
You will need to replace "username" with your username. - Windows Vista/7:


2. Using Chart Templates
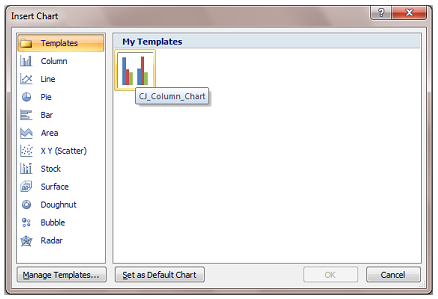
- To insert a chart from the template that you just created, go to "Insert" ribbon and click on "Chart" button under "Illustrations" group.
- Then click on the "Templates" menu item from the left panel.
- Here you can see the chart template that you created appears on the write panel. Double-click on the template icon to insert the chart.

3. Installing Custom Chart Templates on a Different Computer
- To install chart templates onto another PC, go to the following folder in your computer, depending on your operating system:
- Windows Vista/7:
"C:\Users\Username\AppData\Roaming\Microsoft\Templates\" - Windows XP:
"C:\Documents and Settings\Username\Application Data\Microsoft\Templates\"
- Windows Vista/7:
- Copy the "Charts" folder that you find into a portable drive (E.g., USB thumb drive).
- On the other computer, go to the same folder path mentioned above depending on your operating system and paste the "Charts" folder there.
- To insert a custom chart template in PowerPoint, follow step 2.
You can use templates like this across the MS Office suite to make professional looking documents, spreadsheets, presentations, etc., without wasting a lot of time repeating tedious formatting and style tasks.
If you have any question or recommendation, please leave a comment.
If you have any question or recommendation, please leave a comment.
No comments:
Post a Comment